Read Time: 344 words, about 3 minutes.
Studying animal movement is crucial. Animal movement research is conducted to monitor ecosystem health, understand ecological dynamics and address management and conservation questions.
In marine environments, there are different methods to measure fish movement. From nets, tags and statistical modelling, the use of different techniques are providing us with new information about fish movement in aquatic ecosystems. But, what is the next technology that can help collect the new generation of fish movement data?
Our new study published in Aquatic Conservation: Marine and Freshwater Ecosystems found that computer vision can benefit fish movement research. Computer vision; defined as the scientific field that develops computers to interpret digital images or videos, can process digital imagery quicker and more accurately than humans.
In fish movement research, the use of digital imagery is increasing, but the implementation of automated techniques has been slow when compared to other research areas (i.e. aquaculture and coral reef ecology). In the study, we propose that CV can benefit fish movement research in two key ways:
Computer vision can complement traditional data collection techniques
CV can complement in-diver visual assessment because it can be deployed at many sites and cover large spatial scales.
Computer vision can provide rapid, automatic and consistently high-quality datasets
We have previously shown that CV can process and classify underwater fish imagery 40× faster than human experts and citizen scientists. The capacity of CV to be adopted alongside traditional approaches, the unparalleled speed, accuracy and reliability of these approaches, and the benefits of CV to study ecosystems over multiple scales make CV a valuable tool to assess connectivity. CV thus has the capacity to inform data-driven decisions that directly influence the health and productivity of marine ecosystems.
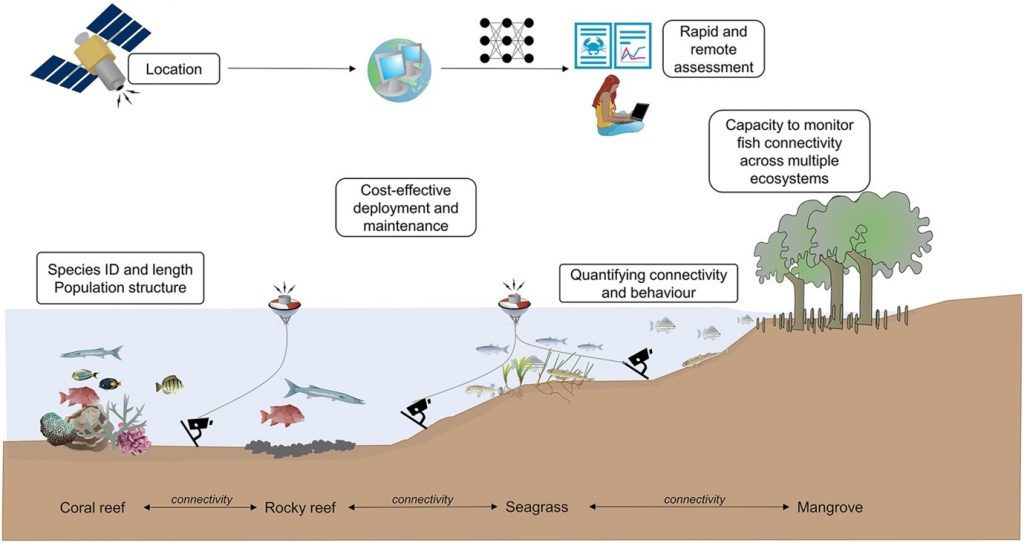
Schematic diagram illustrating the many advantages of computer vision techniques and parameters that can be measured to enhance the study of fish connectivity. The ecological data collected by underwater camera stations in this example can be collected across multiple ecosystems and transmitted to computers through satellites to be quickly processed for rapid and remote assessments of connectivity. Symbols courtesy of ian.umces.edu/symbols/
Paper: https://doi.org/10.1002/aqc.3432
Note: This article was originally published by the GLOW project, find the original article here.
Author’s Twitter: @seabassphd
